 |
Downward comparison in close relationships
A blessing in disguise? |
|||||||
Thesis, University of Groningen, June 1999
© Frans Oldersma, Groningen, The Netherlands, |
||||||||
|
||||||||
Chapter 2: Consequences of cognitive downward comparison for the perceived quality of the relationship
Study 3c
The buffering effect of relationship-enhancing downward comparison for those high in comparison orientation
A replication study in a laboratory setting
Results
Data Analytic Procedure
Analytical procedures were identical to those employed in Study 2. We first examined the mean scores of the study variables in the experimental conditions, as well as the correlations between all study variables. Next, the dependent variables at Time 2 were included in hierarchical moderated regression analyses.
Preliminary Descriptive Analyses
Means and standard deviations of all study variables are displayed in Table 2. One-way analyses of variance with cognitive set (no-comparison versus downward comparison) as independent variable indicated no initial differences between both conditions on the criteria variables, Fs < 1.47, ns, although participants in the downward comparison condition reported marginally less discontent at Time 1 than those in the no-comparison condition, F(1, 108) = 3.48, p = .07.5
No difference was found in social comparison orientation, F < 1, ns. However, in accordance with our prediction, cognitive set significantly or marginally significantly influenced the dependent variables at Time 2. As the means in Table 2 indicate, participants in the comparison condition reported more satisfaction, F(1, 108) = 3.59, p = .06, commitment, F(1, 108) = 4.17, p < .05, and a higher quality of the relationship, F(1, 108) = 3.73, p = .06, than participants assigned to the no-comparison condition. |
|
TABLE 2
Means for study variables as a function of cognitive set in study 3
a N = 55
b N = 55 Furthermore, the dependent variables were submitted to two-way ANOVAs with Cognitive Set as a between-subjects variable, and Time (Time 1 versus Time 2) as a repeated-measure variable to test the prediction that the downward comparison thought-generating task would exert a more positive influence on perceived relationship quality than the no-comparison thought-generating task. The ANOVAs revealed a significant interaction between cognitive set and time on satisfaction, F(1, 108) = 5.25, p < .03, and marginally significant interactions on commitment, F(1, 108) = 2.57, p = .11, and relationship quality, F(1, 108) = 2.75, p = .10.
Next, t-tests (one-tailed) were performed to test the differences between Time 1 and Time 2 levels of the dependent variables. Relative to prior levels of satisfaction, participants in the no-comparison thought-generating task displayed significantly less satisfaction, t(54) = -1.80, p < .04, whereas participants displayed marginally more satisfaction following the downward comparison thought-generating task, t(54) = 1.43, p < .08. In addition, whereas prior levels of commitment and relationship quality did not differ from levels reported following the no-comparison task, ts(54) = -.55 and -.71, ns, participants reported significantly more commitment and higher relationship quality in the downward comparison condition, ts(54) = 1.98 and 1.76, ps < .03 and .04.
In sum, whereas the two previous experiments could not test the assumption that cognitive downward comparisons enhanced perceived relationship quality, these findings offer evidence that the downward comparison thought-generating task resulted in an increase in relationship quality whereas the no-comparison thought-generating task did not affect relationship quality. |
||||||||||||||||||||||||||||||||||||||||||||||||||||||||||||||||||||||||||||||||
|
Finally, as can be seen in Table 3, the variables measuring relationship quality were significantly correlated. Not surprisingly, relational discontent was highly correlated with the measures of relationship quality. Comparison orientation showed small, but mostly statistically significant relations with the relationship variables.
Regression Analyses
Relationship satisfaction. The main effects of cognitive set, relational discontent, and social comparison orientation accounted for a significant amount of variance in satisfaction,
However, the predicted Cognitive Set X Relational Discontent interaction emerged (B = .27, t(103) = 2.06, p < .05). Inspection of this interaction revealed that comparative thought-generating was a more effective buffer against relational discontent than the task in which noncomparative thoughts about the partner were generated: Relational Discontent was less strongly predictive of satisfaction in the downward comparison condition (B = .66, t(103) = 6.81, p < .0001) than in the no-comparison condition (B = -.93, t(103) = 9.81, p < .0001). |
|
TABLE 3
Pearson correlations among variables in study 3
* p < .05; ** p < .001, one-tailed.
However, this interaction was subsumed by the expected three-way interaction that accounted for an additional amount of variance in relationship satisfaction (B = .30),
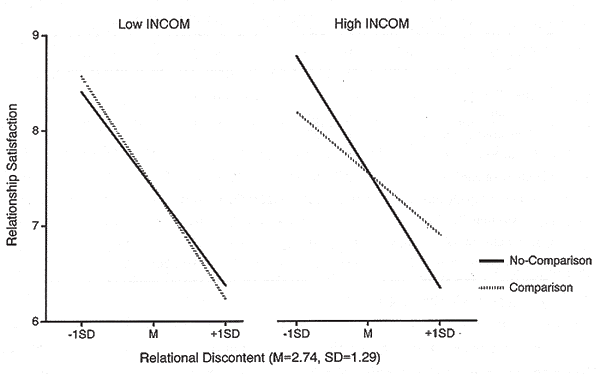
As shown in Figure 3, the three-way interaction is similar to that found in Study 2. Inspection of the slopes of the standardized form of the equation revealed that the relation between discontent and satisfaction was significant and negative in all conditions. For those low in social comparison orientation, discontent and satisfaction were significant related following the downward comparison thought-generating task (B = -.96, t(102) = 5.40, p < .0001), and following the no comparison task (B = .83, t(102) = 5.92, p < .0001). Among participants high in social comparison orientation, however, this negative association was more pronounced in the no-comparison condition (B = -1.00, t(102) = 8.02, p < .0001) than in the downward comparison condition (B = -.52, t(102) = 5.24, p < .0001). Thus, in line with our prediction, the Cognitive Set X Relational Discontent interaction appeared to be stronger as participants were to a greater extent oriented toward social comparison.
 FIGURE 3. Study 3: Regression of relationship satisfaction on relational discontent as measured prior to the experimental task within the no-comparison and downward comparison conditions. Relationship satisfaction was regressed on discontent at low (1 SD below the mean) and high (1 SD above the mean) levels of social comparison orientation (INCOM; M = 3.41, SD = .64).
Commitment to the relationship. The main effects of cognitive set, relational discontent, and social comparison orientation accounted for a significant amount of variance in commitment, |
||||||||||||||||||||||||||||||||||||||||||||||||||||||||||||||||||||||||||||||||||||||||||||||||||||||||||||||||||||||||||||||||||
|
Entering the two-way interactions at the second step did not account for further incremental variance in commitment,
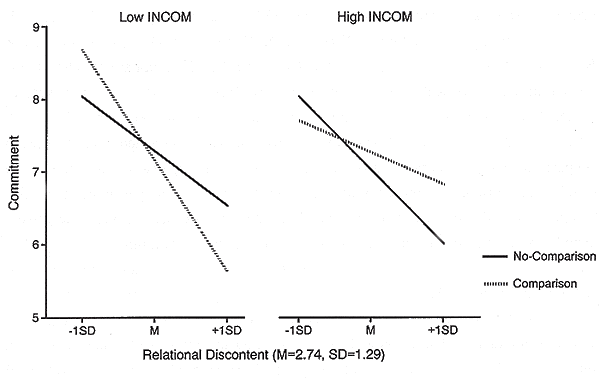
As for satisfaction, this two-way interaction was qualified by the predicted three-way interaction that accounted for a significant portion of explained variance in commitment (B = .50), |
 FIGURE 4. Study 3: Regression of commitment to the relationship on relational discontent as measured prior to the experimental task within the no-comparison and downward comparison conditions. Commitment was regressed on discontent at low (1 SD below the mean) and high (1 SD above the mean) levels of social comparison orientation (INCOM; M = 3.41, SD = .64).
Perceived relationship quality. The main effects of cognitive set, relational discontent, and social comparison orientation accounted for a significant amount of variance in perceived quality of the relationship,
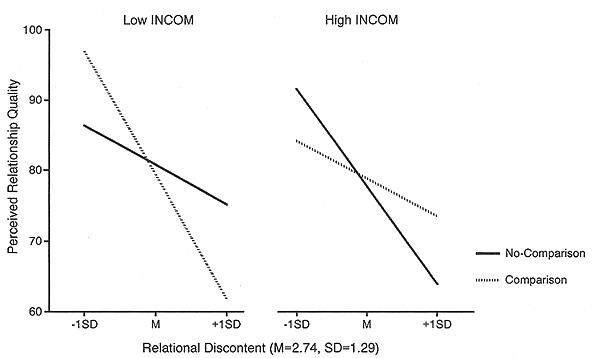
However, the three-way interaction accounted for an additional proportion of explained variance in perceived quality of the relationship (B = .68),
 FIGURE 5. Study 3: Regression of perceived quality of the relationship on relational discontent as measured prior to the experimental task within the no-comparison and downward comparison conditions. Perceived relationship quality was regressed on discontent at low (1 SD below the mean) and high (1 SD above the mean) levels of social comparison orientation (INCOM; M = 3.41, SD = .64).
Analyses of the Response Latencies
To assess the effects of cognitive set on the response times we followed the same analytical strategy as in Study 1. Although the analyses were performed on the transformed latencies, for clarity we present the retransformed scores. The transformed response latencies were submitted to one-way analyses of covariance (ANCOVAs), with the baseline index for response time as a covariate.&sup6; In line with the reported effects in Study 1, a main effect emerged of cognitive set on the latency index of satisfaction. Participants in the comparison condition responded faster to the scales of relationships satisfaction, F(1, 89) = 4.96, p < .03, than participants assigned to the no-comparison thought-generating task. As predicted, the mean latencies (adjusted for individual differences in response latencies) in the comparison condition and in the no-comparison condition were 7.94 versus 8.74. Although the mean latencies to the commitment index were shorter in the comparison condition (9.06) than in the no-comparison condition (9.31), the difference in response latencies did not reach conventional levels of significance, F < 1, ns. Furthermore, to explore the interaction effects of cognitive set, relational discontent, and comparison orientation on the latency indexes, we followed the same regression analytical strategy as for the self-report measures of relationship quality. The hierarchical moderated regression analyses did not qualify the reported main effect on the satisfaction latency index, nor did any interaction effects on the commitment latency index approach statistical significance. To summarize briefly, the main effect on the satisfaction latency index due to type of cognitive set replicated the results of Study 1, suggesting that cognitive downward comparison increases especially the accessibility of the attitude toward relationship satisfaction.
Supplemental analyses
As noted in the previous studies, possible alternative explanations of the obtained findings required additional analyses. First, it was examined if the number of qualities generated in both conditions could account for the results. There was no effect of cognitive set, F(1, 108) = .55, ns, upon the number of qualities generated. When controlling for the number of qualities, all of the major analyses were replicated.
Unlike in Study 1, in Study 3 the participants did not rate the positivity of the qualities they generated. However, the qualities listed in the comparison and in the no-comparison condition were rated by two independent judges on 5-point scales ranging from very negative to very positive. The judges were blind to hypothesis and experimental conditions, and the interrater agreement was high, as indicated by a Cohen's Kappa of .96.
First, an analysis of variance revealed that the two judges did rate the qualities in the comparison condition a little more positively (M = 4.16) than those generated in the no-comparison condition (M = 4.10), but the difference between both conditions was not statistically reliable, F (1, 109) = 3.37, p = .07. Secondly, regression analyses failed to find any effects of relational discontent (B = .14, ns) and social comparison orientation (B = -.09, ns) on the positivity of the generated qualities. Further, the hierarchical moderated regression analyses were repeated after adding the positivity ratings of the qualities in the first step. Again, after controlling for the positivity of the generated qualities, all of the major analyses were replicated. Thus, these regression analyses do not support the alternative account that the findings are due to the greater positivity of the qualities listed in the comparison condition relative to the qualities that were generated by the participants in the no-comparison condition.
5. In the hierarchical moderated regression analyses prior levels of discontent was entered simultaneously with cognitive set and social comparison orientation in Step 1 so that the regression statistics explain prediction of T2 criteria by the predictor variables and their product terms independent of prior relational distress. Therefore, the marginally significant difference of discontent between the downward and the no-comparison conditions at Time 1 is not discussed further.
6. Before performing the analyses of covariance, preliminary analyses confirmed that the assumption of homogeneity of regression slopes within both conditions was upheld. |
|
||||||
 |
© Frans Oldersma. Mail: Frans Oldersma
Painting: L'Autunno by Laurens Boersma Webdesign: Smeets & Graas | Een Groninger Website |
|||||